Platform Engineer
Ingestion, API, gateway, broker, data freshness, and backend service visibility.

TELEMETRY SOURCE HEALTH
Operational teams depend on many telemetry sources: edge devices, gateways, APIs, brokers, historians, files, databases, meters, sensors, and service feeds. PulseBoard can help bring available source status, data freshness, alert context, and dashboard views into one managed operational context so teams can understand where signals are flowing, where coverage is weak, and which sources need attention.
Telemetry issues often start upstream of the dashboard. A device may stop reporting, a gateway may fall behind, a file may arrive late, an API may return incomplete data, or a broker stream may lose expected signals. PulseBoard can help teams review available source status, freshness indicators, alert states, recent changes, and operational context without turning every investigation into a search across disconnected systems.
Source health views
PulseBoard views can be prepared around the telemetry-source questions teams already ask: which sources are reporting, which feeds are delayed, which gateways or APIs need review, which environments are affected, and which operational views depend on those signals.
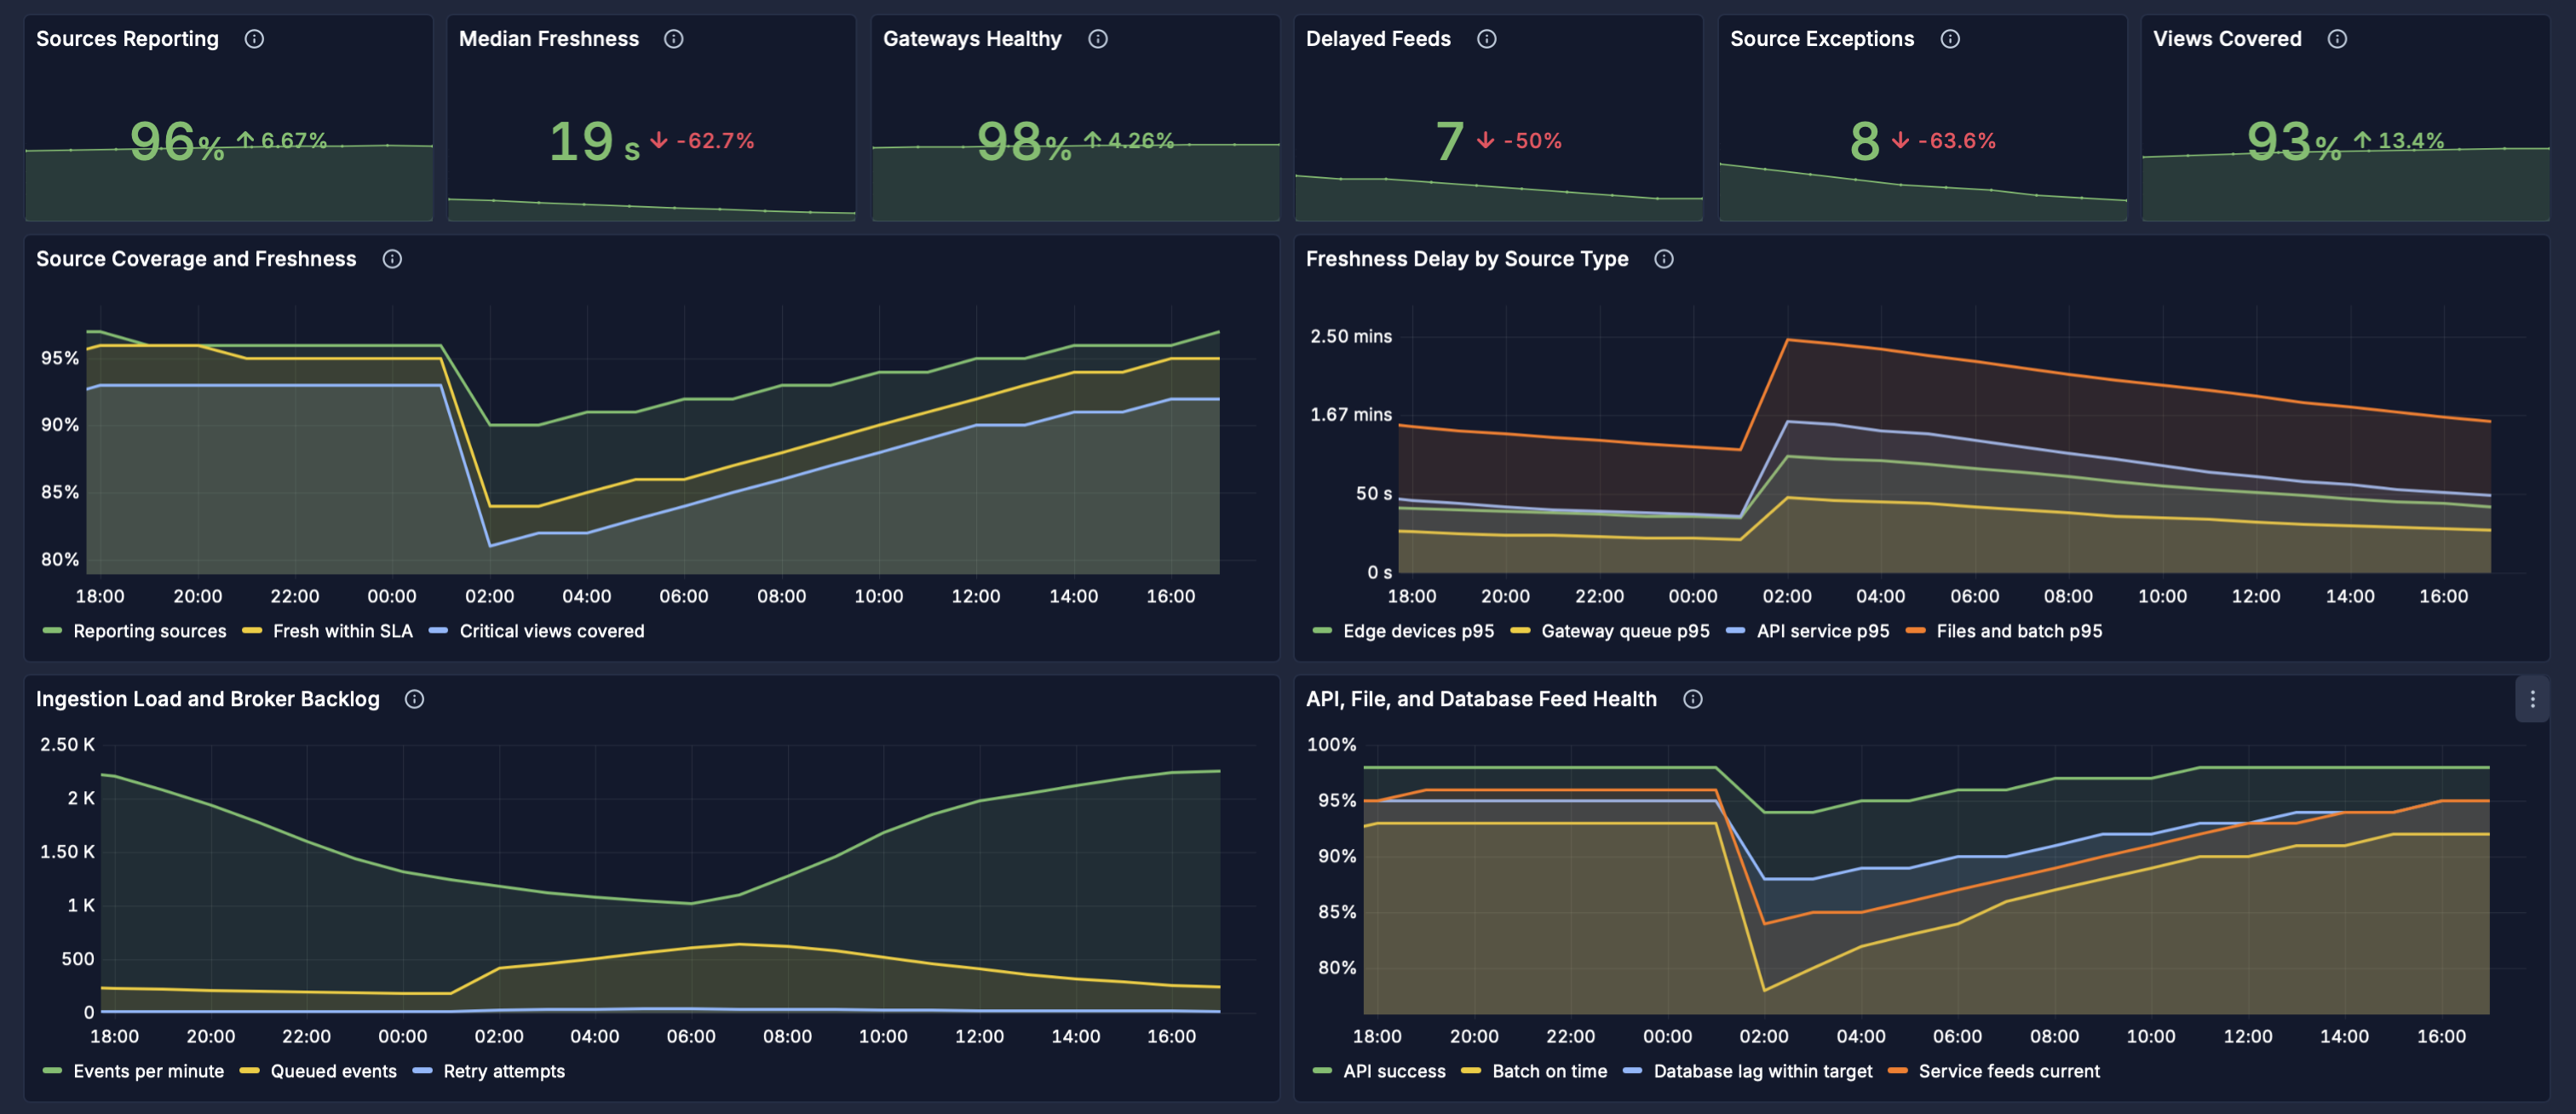
Review reporting coverage, median freshness, gateway health, delayed feeds, source exceptions, affected views, ingestion load, broker backlog, and feed health in one source-health view.
When a feed degrades, teams need to understand source families, operating scopes, affected views, owners, and follow-up workflow. PulseBoard can help keep source-health context connected to operational impact and response.
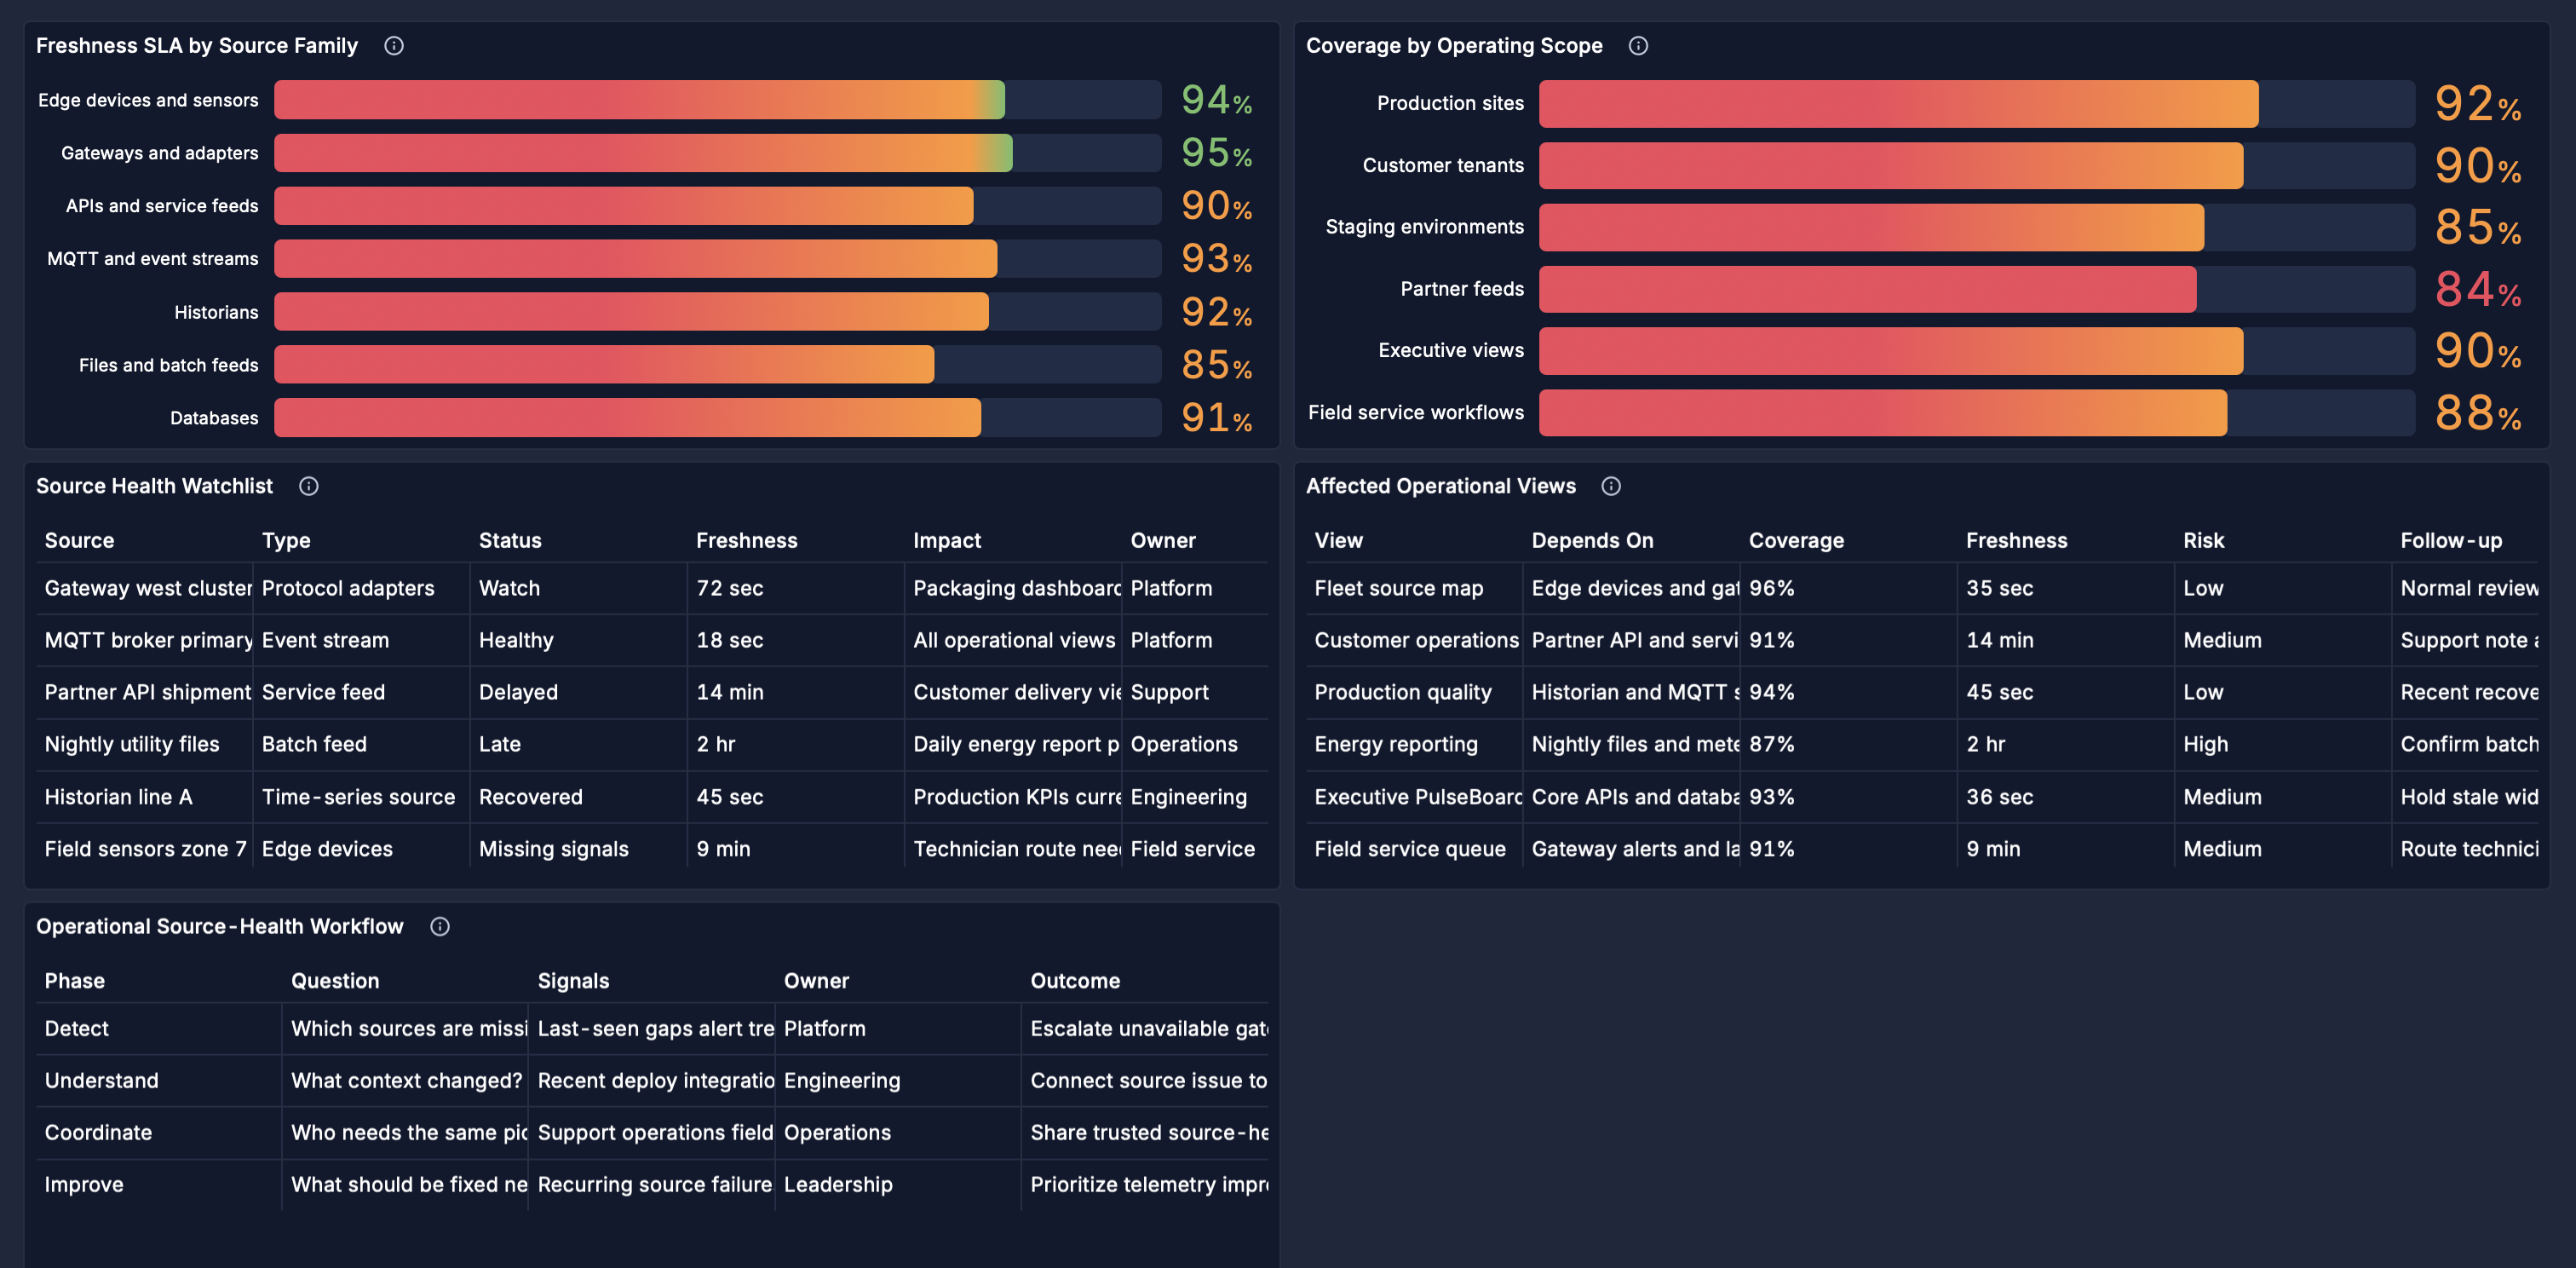
Pair source-family freshness, operating-scope coverage, watchlist status, affected operational views, owners, impact, and follow-up workflow for coordinated review.
PulseBoard is designed to work around the telemetry estate that already exists. Source-health views may include devices, gateways, APIs, files, brokers, databases, environments, tenants, sites, and customized operational dashboards.
Surface missing signals, delayed feeds, unavailable gateways, stale data, or recurring source exceptions.
Review source status alongside recent operating patterns, alert context, affected views, and environment scope.
Share trusted source-health context across engineering, support, operations, field teams, and management.
Use repeated source issues and coverage gaps to guide practical telemetry improvements over time.
Ingestion, API, gateway, broker, data freshness, and backend service visibility.
Current source status, unresolved exceptions, and operational impact across sites or environments.
Shared context for triage, customer follow-up, and source-related operational response.
Customized views that support device checks, gateway review, and site visit coordination.
Visibility into recurring source failures, telemetry coverage, and improvement priorities.
A customized dashboard shows stale measurements from several sources after a gateway or integration change. PulseBoard can help the team review source availability, last-seen indicators, recent alert states, affected dashboards, environment scope, and related support notes from one operational view. Engineering, support, and operations can coordinate follow-up from the same trusted context instead of switching between disconnected systems.
Cogniaxiom can help map available telemetry sources, identify useful source-health views, and define a managed PulseBoard environment for operational visibility.