Operations Manager
Daily operational health across devices, systems, sites, and unresolved exceptions.

INDUSTRIAL AND IOT OPERATIONS
Industrial and IoT operations depend on many telemetry sources: edge devices, gateways, PLCs, sensors, APIs, brokers, historians, files, databases, and support systems. PulseBoard helps bring available signals from those sources into one managed telemetry context so engineering, operations, support, and management teams can detect issues earlier, investigate changes, and coordinate response from shared operational views.
Industrial issues often cross system boundaries before teams understand the cause. PulseBoard helps consolidate relevant telemetry, alerts, recent changes, and customized dashboards so engineering, operations, support partners, and management can work from the same trusted operational picture.
Industrial telemetry views
PulseBoard views can be prepared around the industrial and IoT signals teams already review: device health, gateway availability, process values, alarm states, communications quality, data freshness, API status, and service-impacting exceptions.
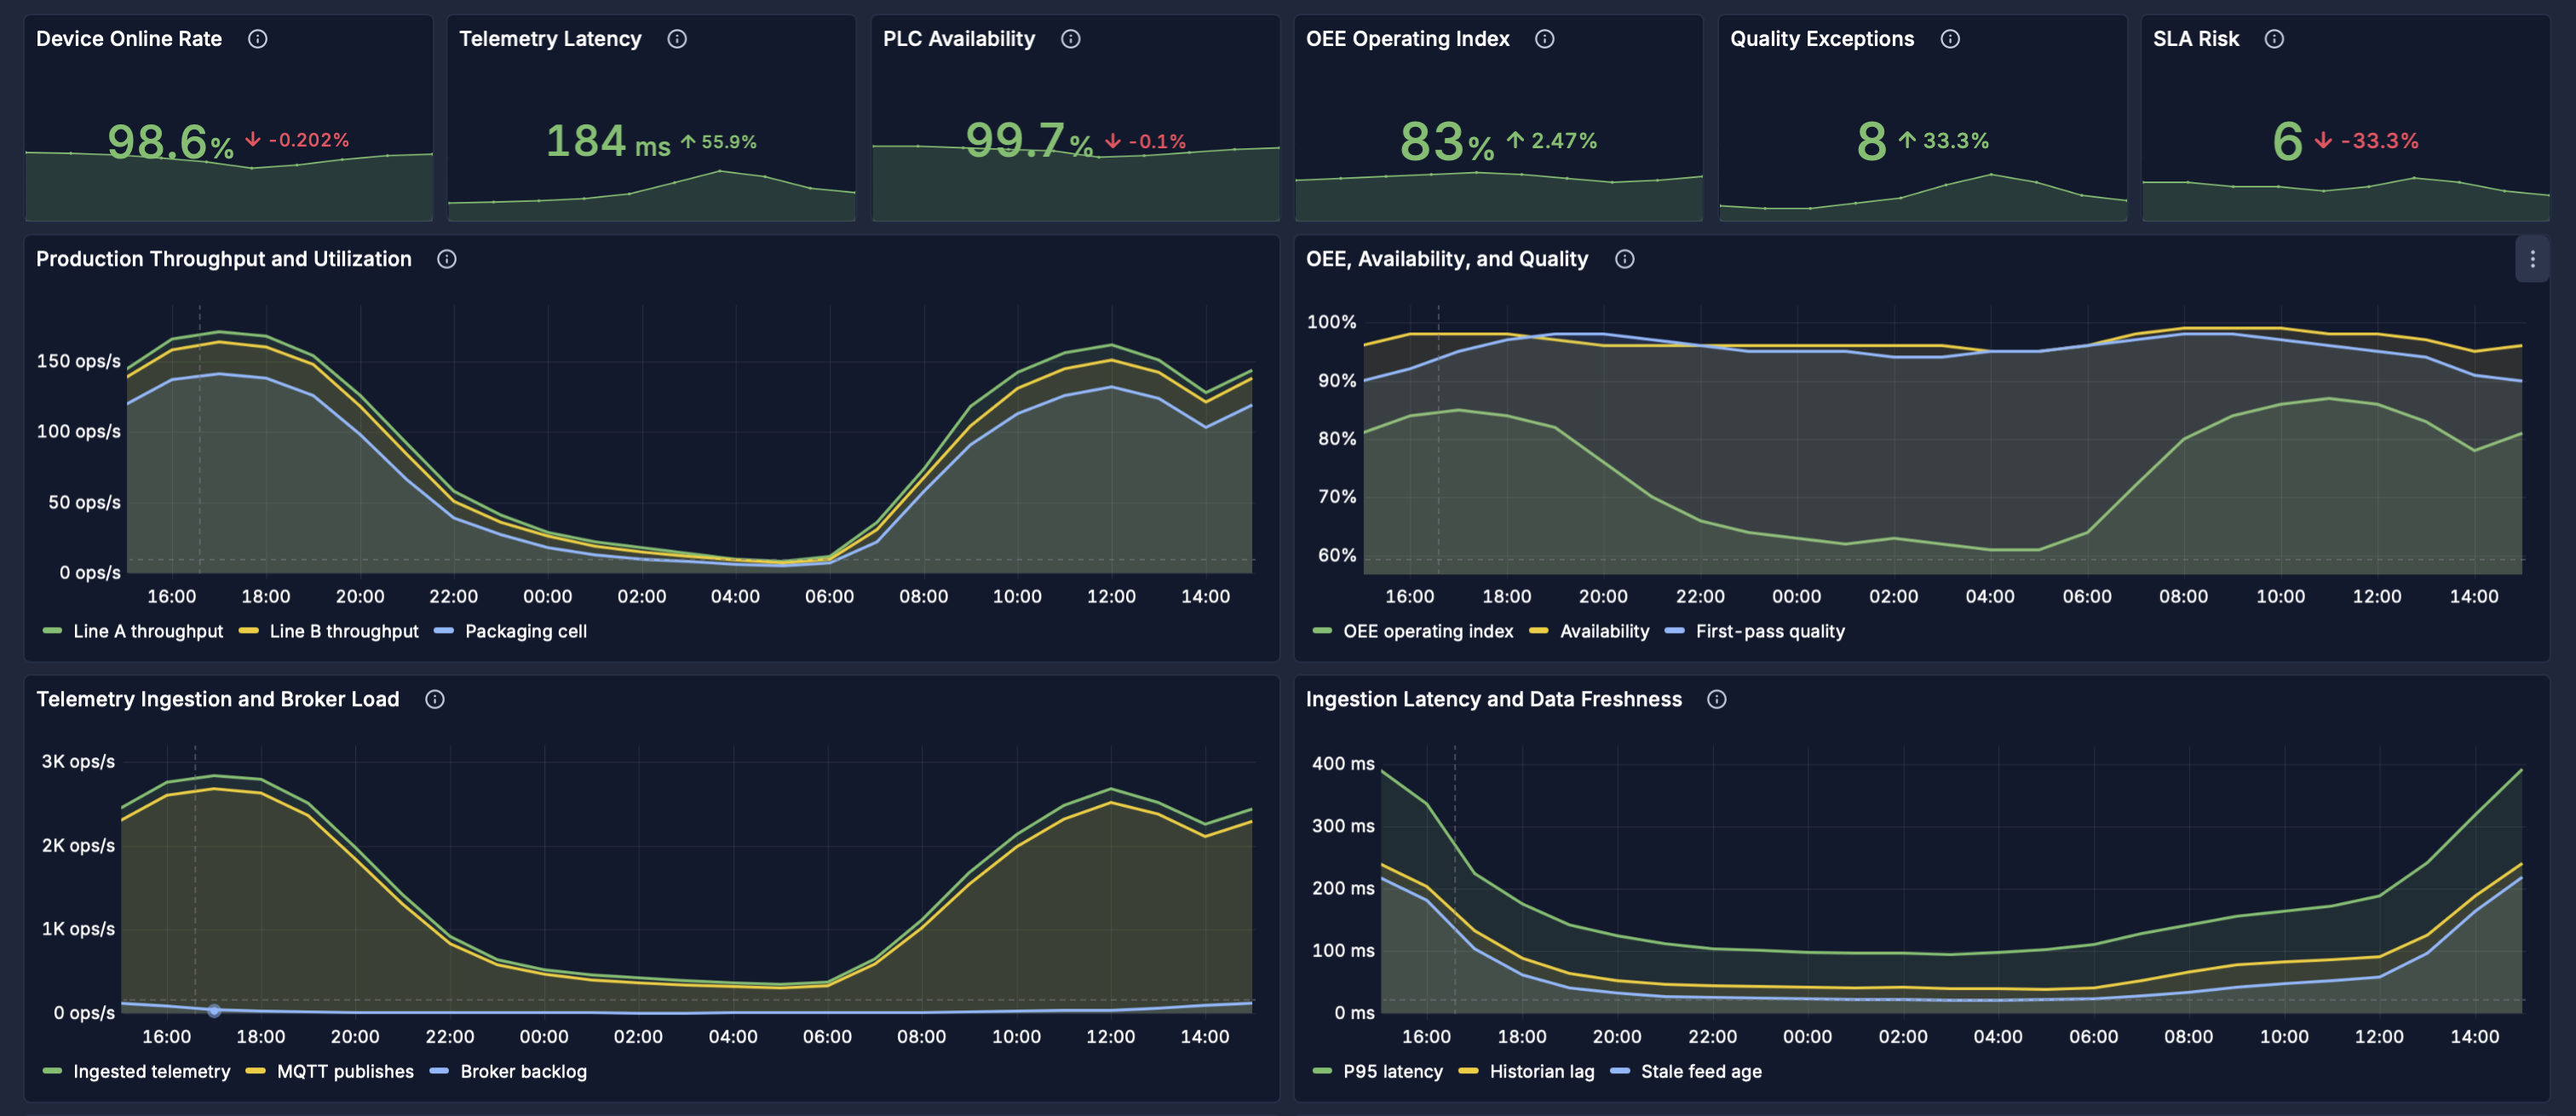
Track device online rate, PLC availability, OEE, quality exceptions, SLA risk, throughput, broker load, ingestion latency, and data freshness from one operating view.
Operational teams can review affected gateways, PLCs, cells, utilities, quality signals, maintenance backlog, owners, and supporting telemetry without turning the incident into a search across disconnected tools.
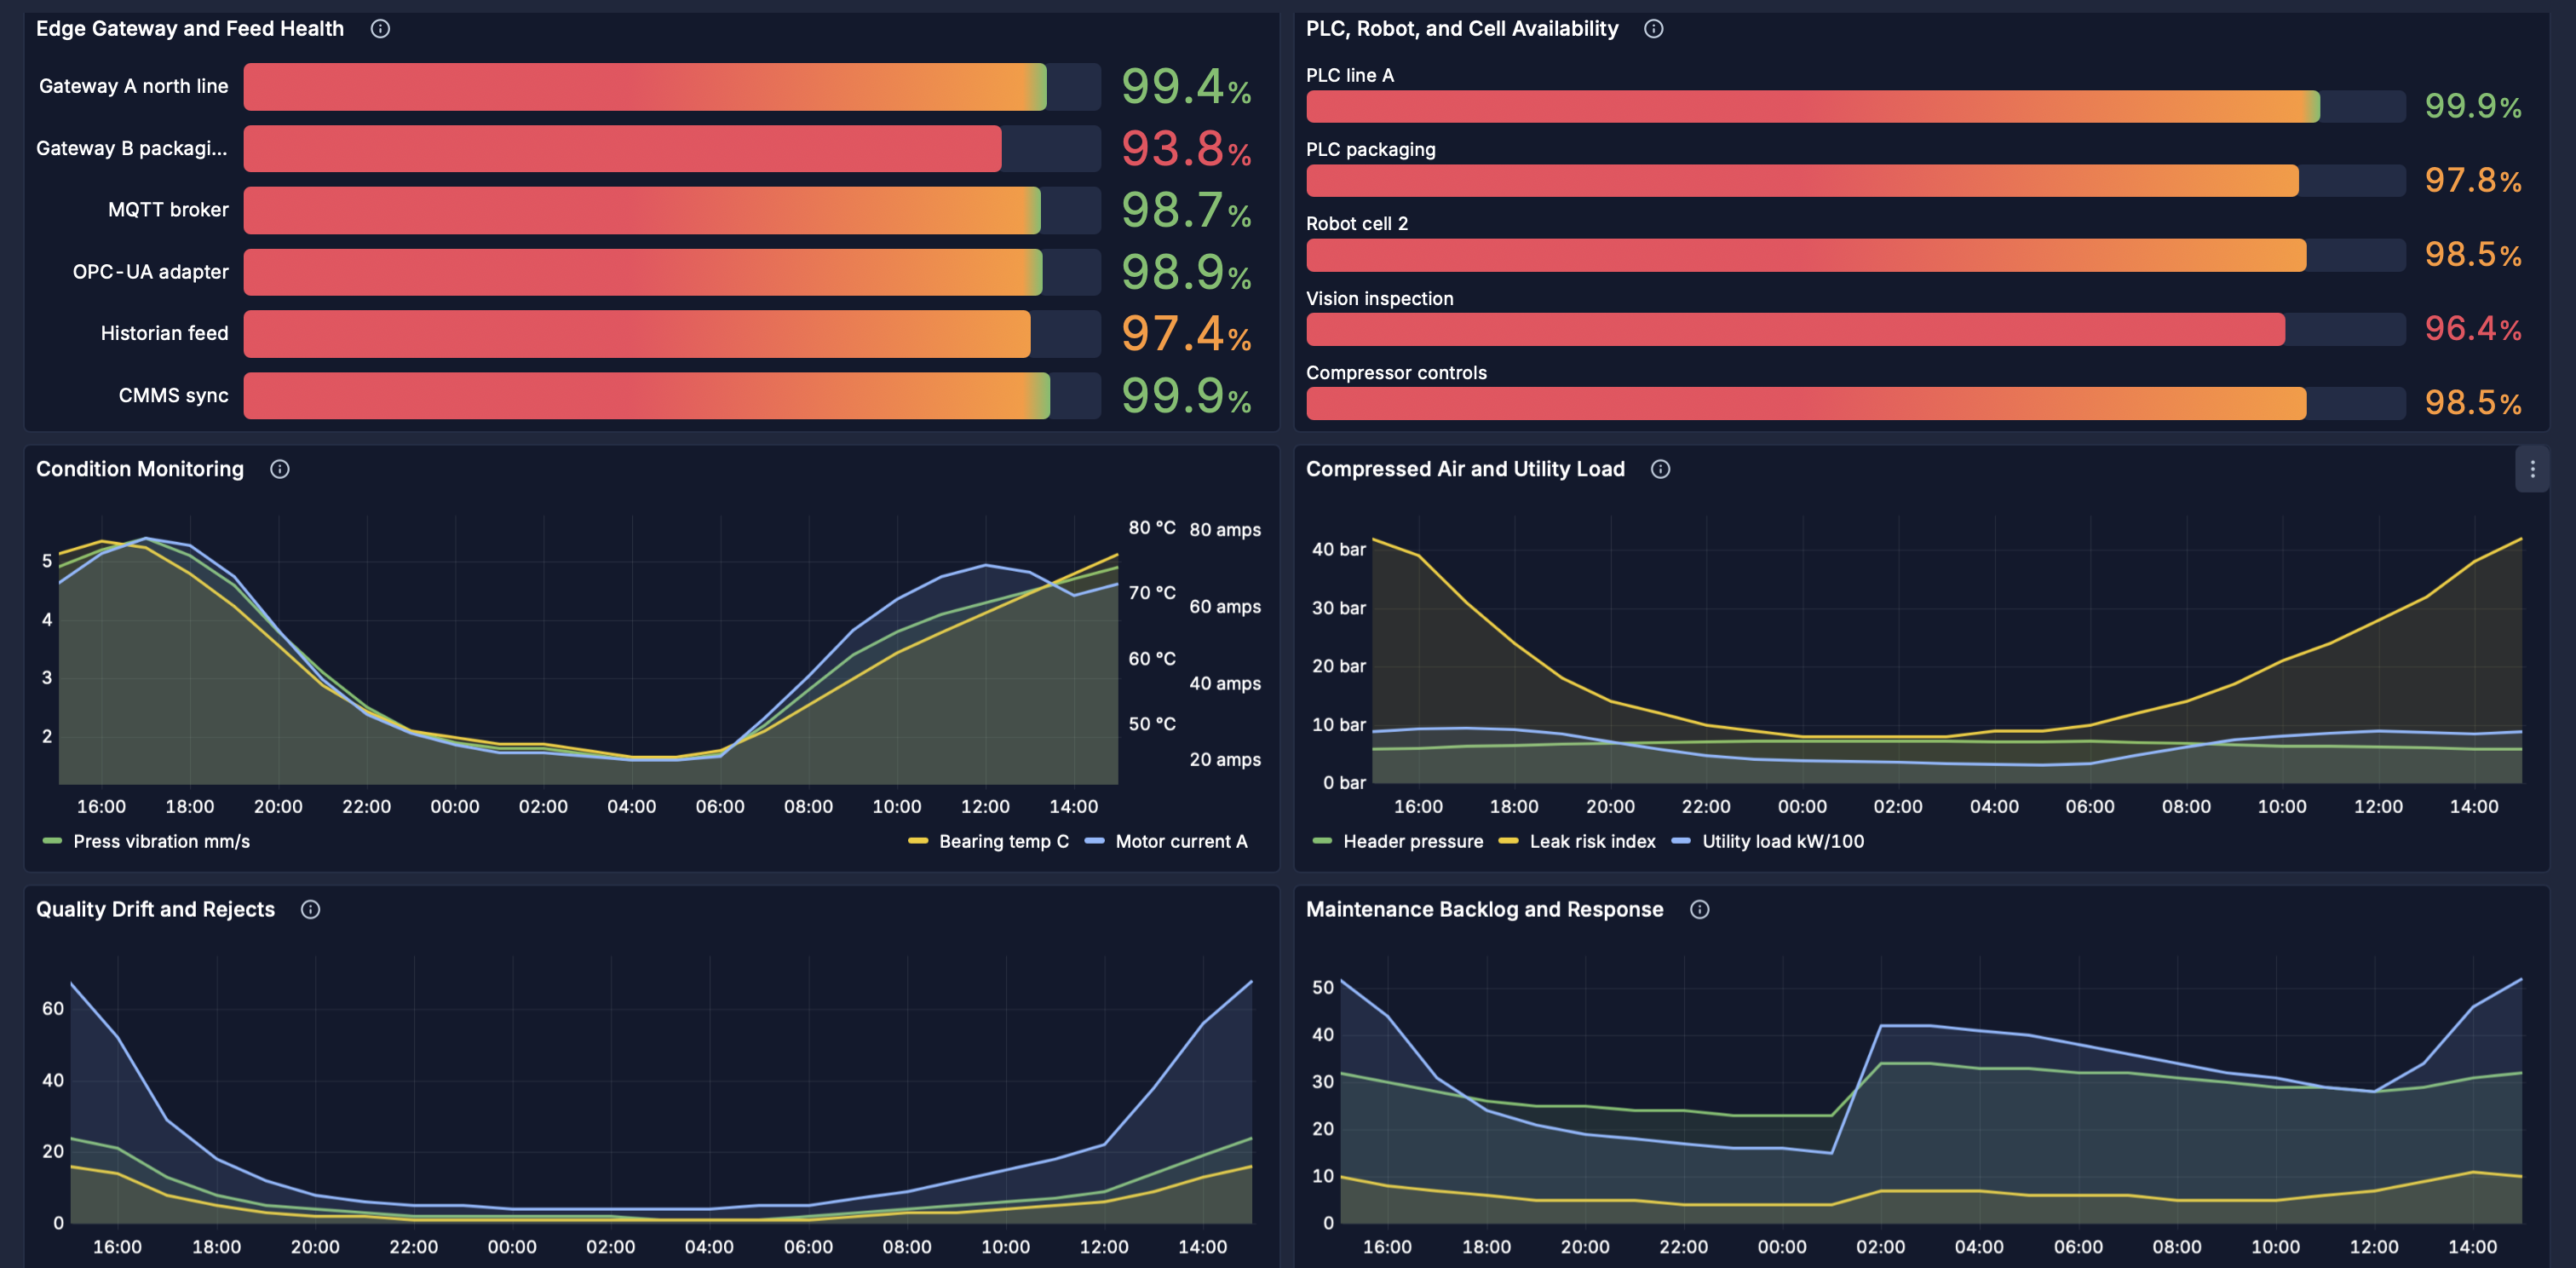
Pair gateway and feed health, PLC and robot cell availability, condition monitoring, utility load, quality drift, and maintenance backlog context for coordinated follow-up.
PulseBoard is designed to work around the telemetry estate that already exists. Industrial and IoT deployments may include field devices, gateways, PLCs, historians, APIs, brokers, files, databases, and managed service feeds.
Surface abnormal telemetry, data gaps, device failures, communications issues, or recurring operational exceptions.
Compare current status with recent operating patterns, alert context, source-system behavior, and customized dashboard views.
Share trusted telemetry context across engineering, operations, support partners, field teams, and management.
Use operational reviews to identify repeat faults, noisy thresholds, integration gaps, and reliability improvements.
Daily operational health across devices, systems, sites, and unresolved exceptions.
Ingestion, API, gateway, data freshness, and backend service visibility.
Shared context for triage, customer follow-up, and operational response.
Customized views that support device checks, maintenance triage, and site visit coordination.
Visibility into recurring failures, reliability risks, telemetry coverage, and improvement priorities.
A site shows missing telemetry from several devices after a connectivity change. PulseBoard can help the team review gateway status, data freshness, recent alert states, affected sources, communications indicators, and related support notes from one operational view. Engineering, support, and operations can coordinate response from the same trusted context instead of switching between disconnected systems.
Cogniaxiom can help map available industrial and IoT signals, identify useful operational views, and define a managed PulseBoard environment for connected operations.