Pulseboard Backend
Managed ingestion, storage, processing, alerting, APIs, and observability for device and data-source telemetry.

Pulseboard by Cogniaxiom
Managed operational telemetry platform by Cogniaxiom.
Pulseboard combines a secure web and mobile frontend with a managed telemetry backend for device/data-source ingestion, processing, storage, dashboards, alerts, and operational context.
Use Pulseboard at the desk and on the phone to stay aligned on operational status, review changes, investigate incidents, and keep teams working from the same trusted telemetry context.

Platform overview
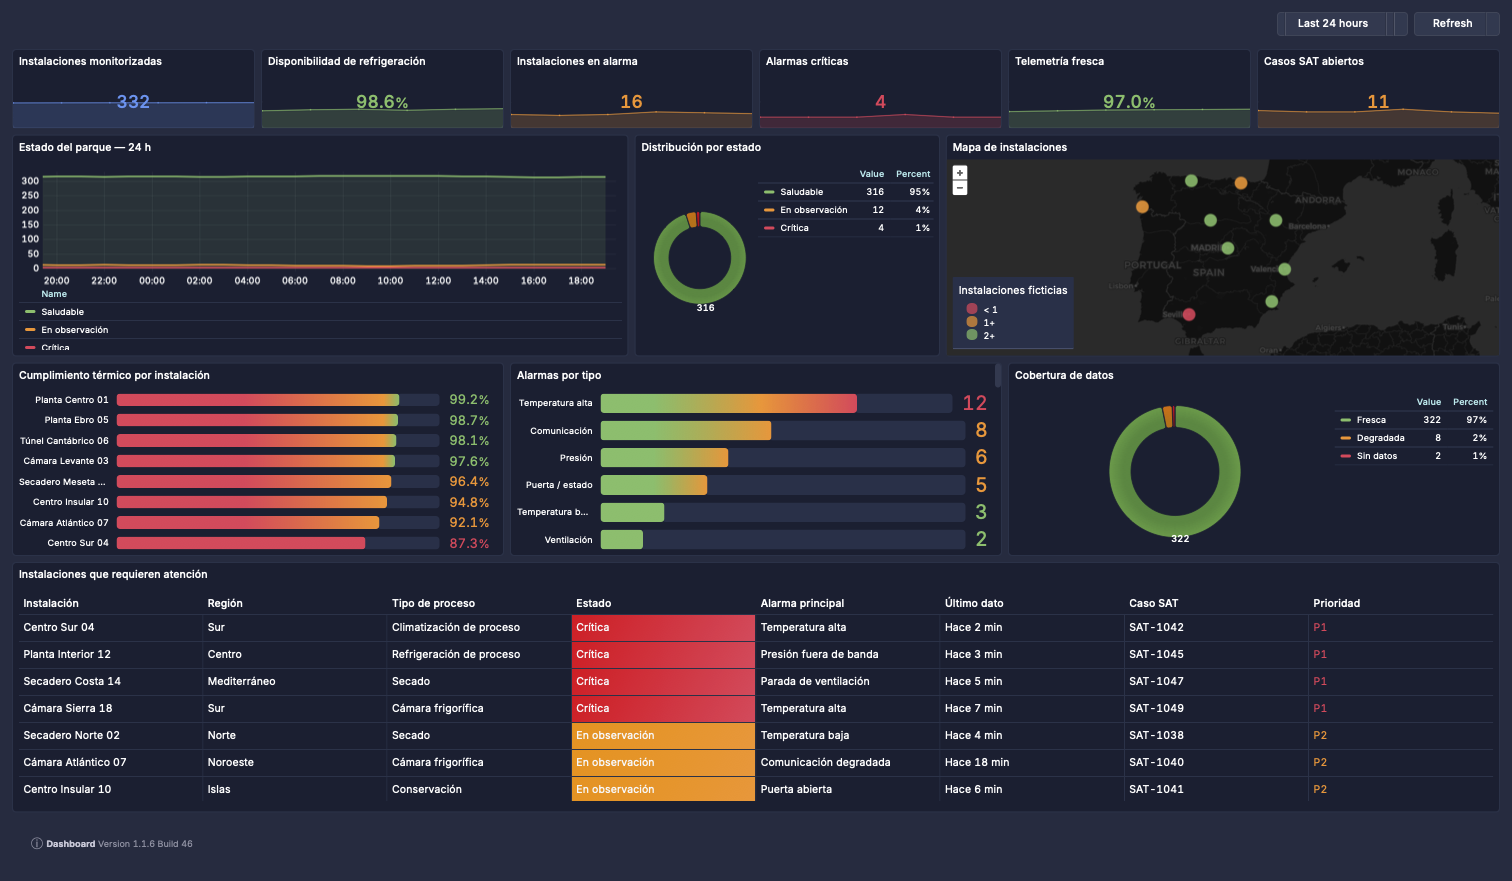
Pulseboard is built for teams that need reliable visibility into industrial, IoT, and operational telemetry. It brings together backend telemetry capacity, protected dashboard access, alert context, and web/mobile workflows in one managed platform.
Managed ingestion, storage, processing, alerting, APIs, and observability for device and data-source telemetry.
Secure web and mobile access to customized operational dashboards, health views, and investigation context.
Monitoring, runbooks, support, operational reviews, and continuous optimisation by Cogniaxiom.
Global telemetry reach
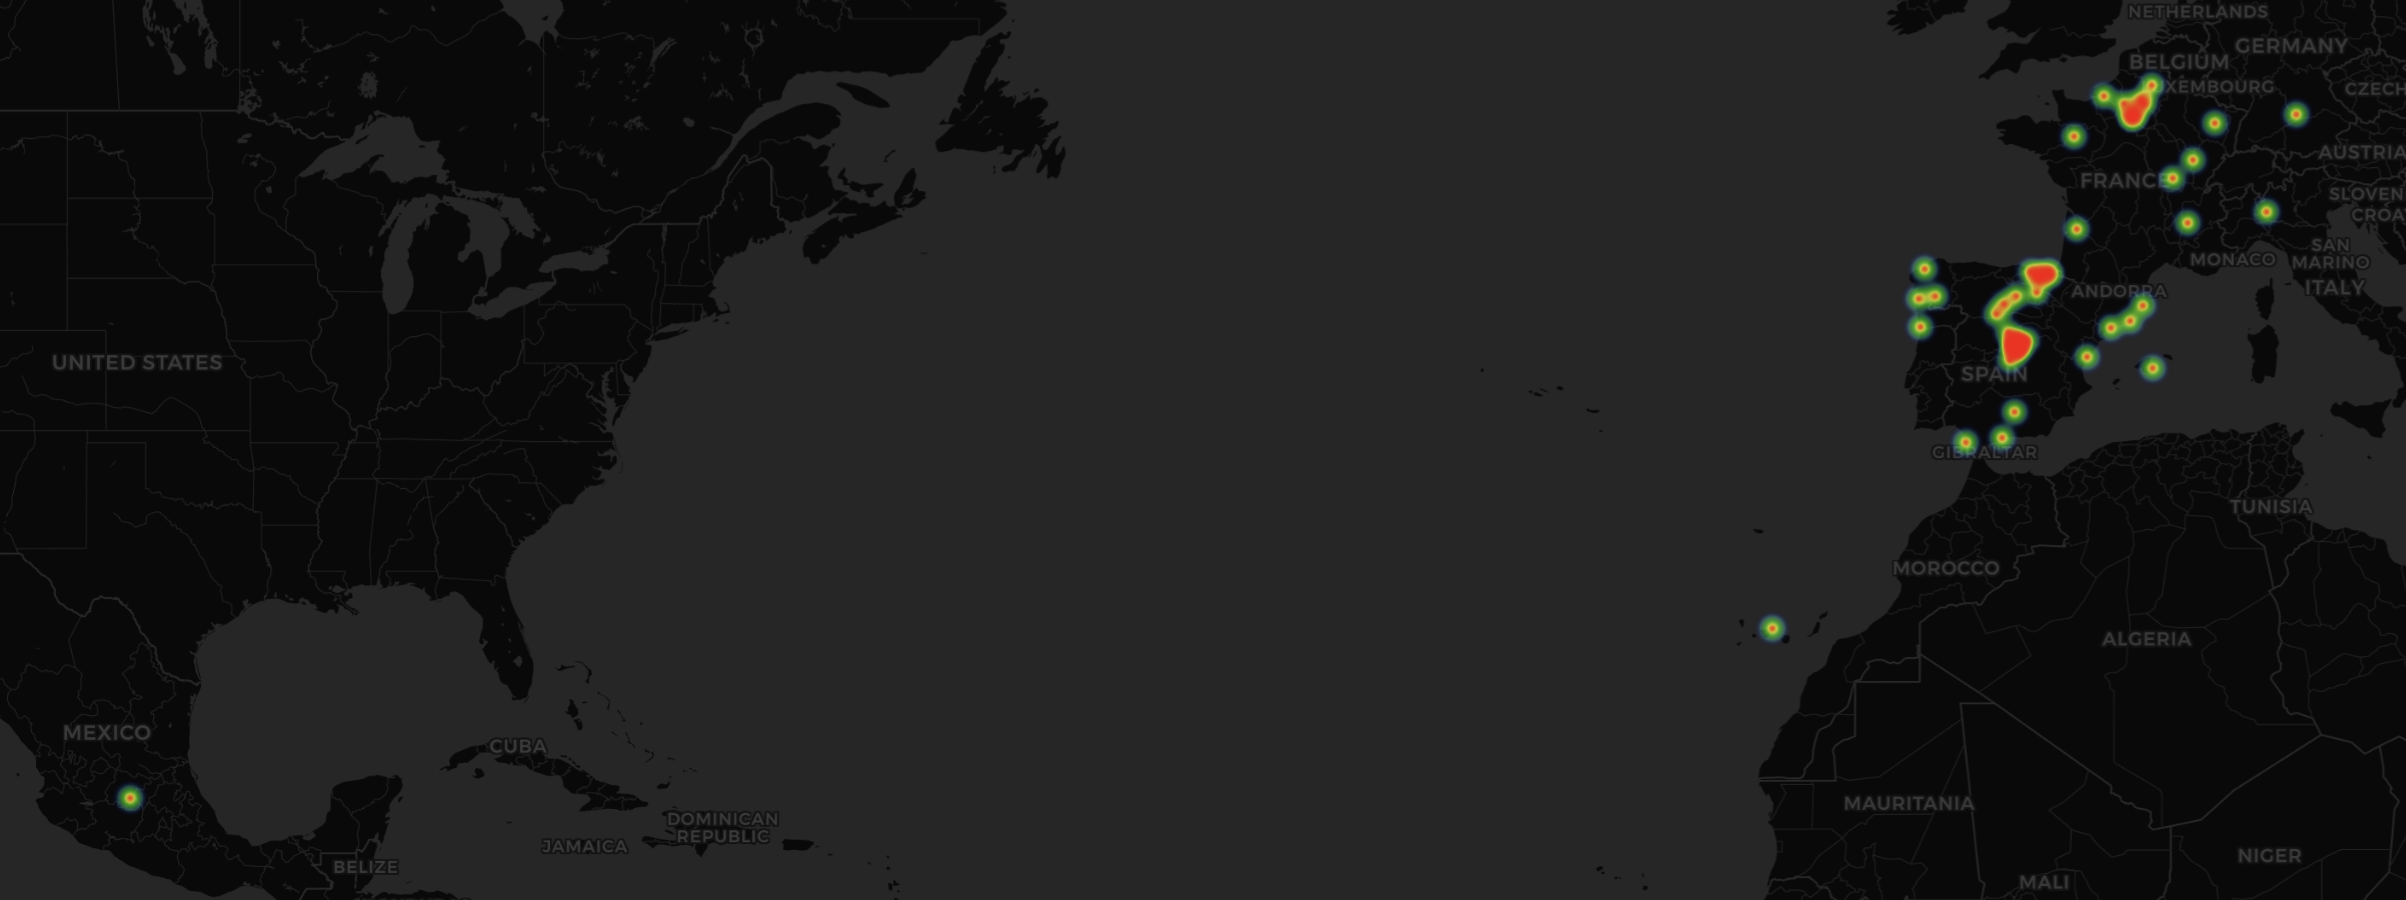
PulseBoard supports telemetry programs with client records flowing across regions, sites, and operational environments.
Map image could not be loaded. Please try refreshing the page.
Authorized users access Pulseboard through secure organization-configured flows, with visibility shaped around operational roles and environments.
Inspect dense operational panels, compare trends, and review multi-day changes from a full browser workspace.
Move from desk checks to mobile follow-up with adapted Pulseboard views available from iPhone and Android.
Managed telemetry backend
Pulseboard is not just a dashboard surface. It includes a managed backend layer for telemetry ingestion, processing, storage, alerting, and operational observability.
Operational workflow
Start from a shared operational view that helps teams understand whether the telemetry estate needs attention.
Open customized dashboards and panels when a quick check needs closer inspection or team discussion.
Keep support, engineering, and operations aligned with the same trusted telemetry context.
Compare what is happening now with recent operating patterns so response work stays grounded.
OPERATIONAL USE CASES
PulseBoard is designed for operational environments where many systems, devices, data sources, and teams need to stay aligned. Use it to consolidate telemetry, alerts, dashboards, and investigation context across oil field drilling, commercial ice equipment, generator fleets, buildings, logistics and fleet operations, energy sites, farms, industrial operations, hotels, and other connected environments.
Unify rig activity, fleet status, asset reliability, alarms, hybrid connectivity, and data quality across drilling operations and mixed equipment fleets.
Explore drilling telemetryConnect available machine signals, alarms, fleet status, source health, diagnosis, distributor coordination, service workflow, and reporting across a distributed installed base.
Explore commercial ice equipment telemetryUnify fleet readiness, alarms, maintenance, service workflow, controller coverage, source health, and customer reporting across distributed generator assets.
Explore generator fleet telemetryUnify installed-base status, thermal compliance, alarms, service workflow, source health, and customer reporting across refrigeration installations.
Explore refrigeration telemetryTrack inverter, meter, weather, battery, grid, fault, and production telemetry across distributed energy assets.
Explore solar telemetryMonitor irrigation, pumps, tanks, soil sensors, weather stations, greenhouse systems, equipment, and environmental conditions.
Explore farm telemetryConnect edge devices, gateways, PLCs, APIs, brokers, historians, files, and existing operational telemetry sources into managed operational views.
Explore industrial telemetryThroughput, quality, machine condition and consumption for palletizers with automatic strapping, bagging machines and load clamps.
Explore machine telemetryConnect equipment telemetry, work orders, source status, alerts, recent changes, and service context into customized views for maintenance, support, and field teams.
Explore service telemetryReview dispatch, route, vehicle, delivery, inventory movement, service, and source-health signals from a shared operational context.
Explore logistics telemetryReview source status, data freshness, gateway health, API feeds, broker streams, files, databases, and operational signal coverage from a shared context.
Explore source-health telemetryUnify visibility across property systems, guest-impacting services, building infrastructure, room technology, maintenance workflows, and portfolio operations.
Explore hospitality telemetryObserve BMS, HVAC, energy, access, environmental, occupancy, and maintenance telemetry from a shared operational workspace.
Explore building operationsDashboard surfaces
Use a wide browser workspace when a team needs more room to compare operational signals, review dashboards, and investigate changes in the telemetry estate.
Compare operational signals, dashboards, and telemetry changes from a full browser workspace.
Keep engineering, operations, and support aligned around the same protected dashboard view.
Move from a quick health check into deeper review without leaving the client dashboard surface.
Review current service behavior and recent change patterns from a consistent browser entry point.
Mobile continuity
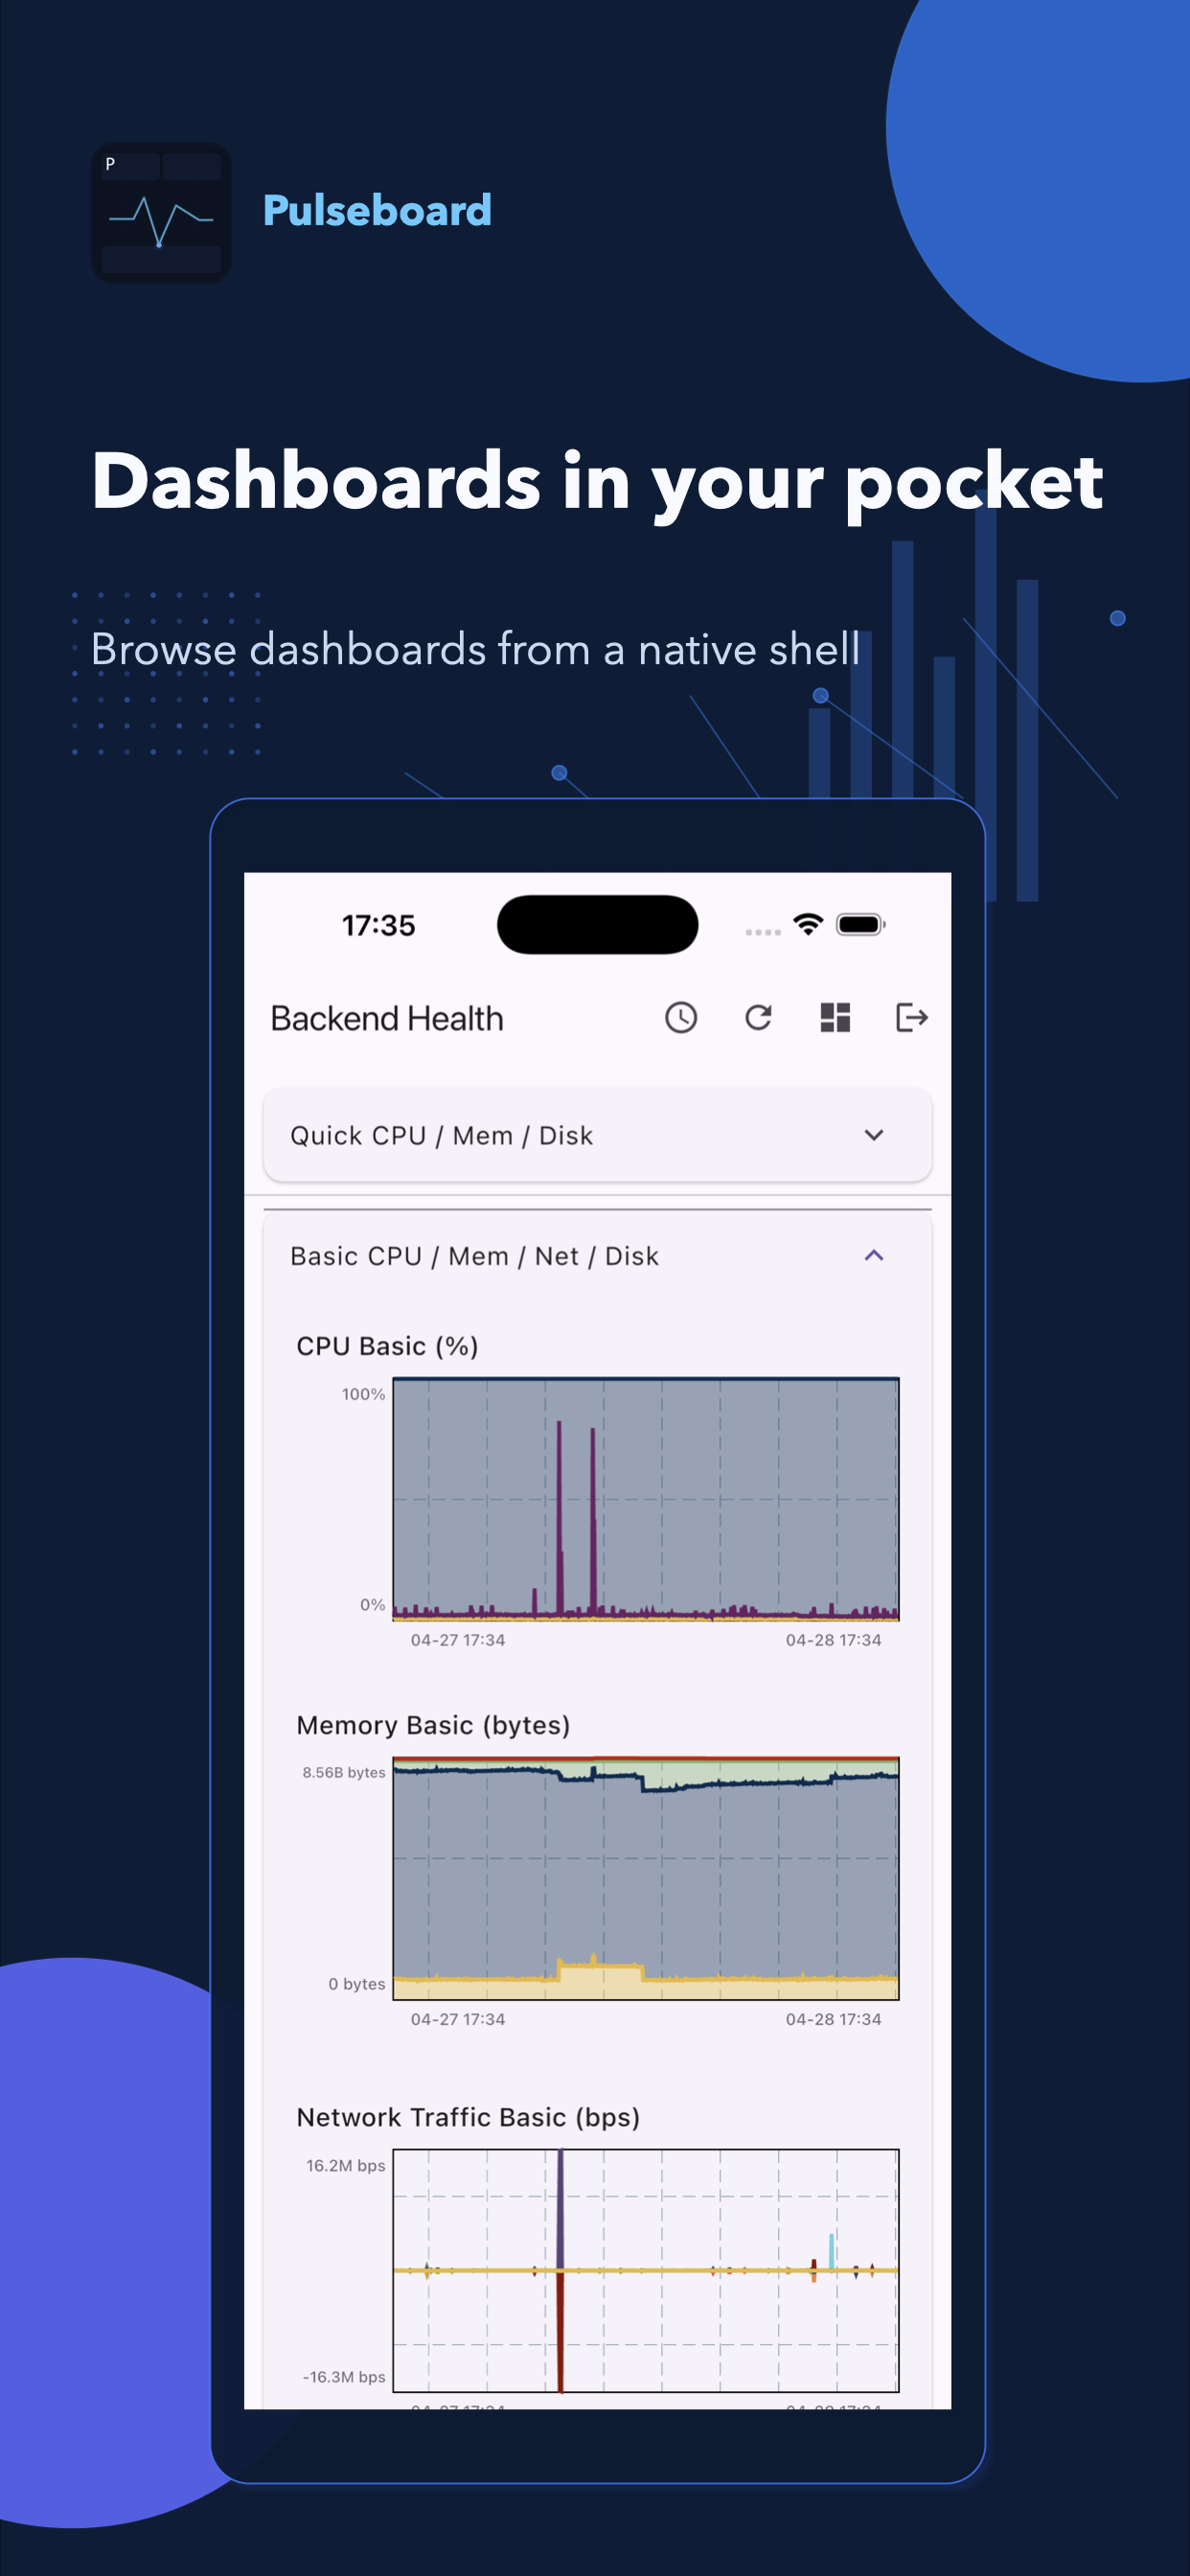
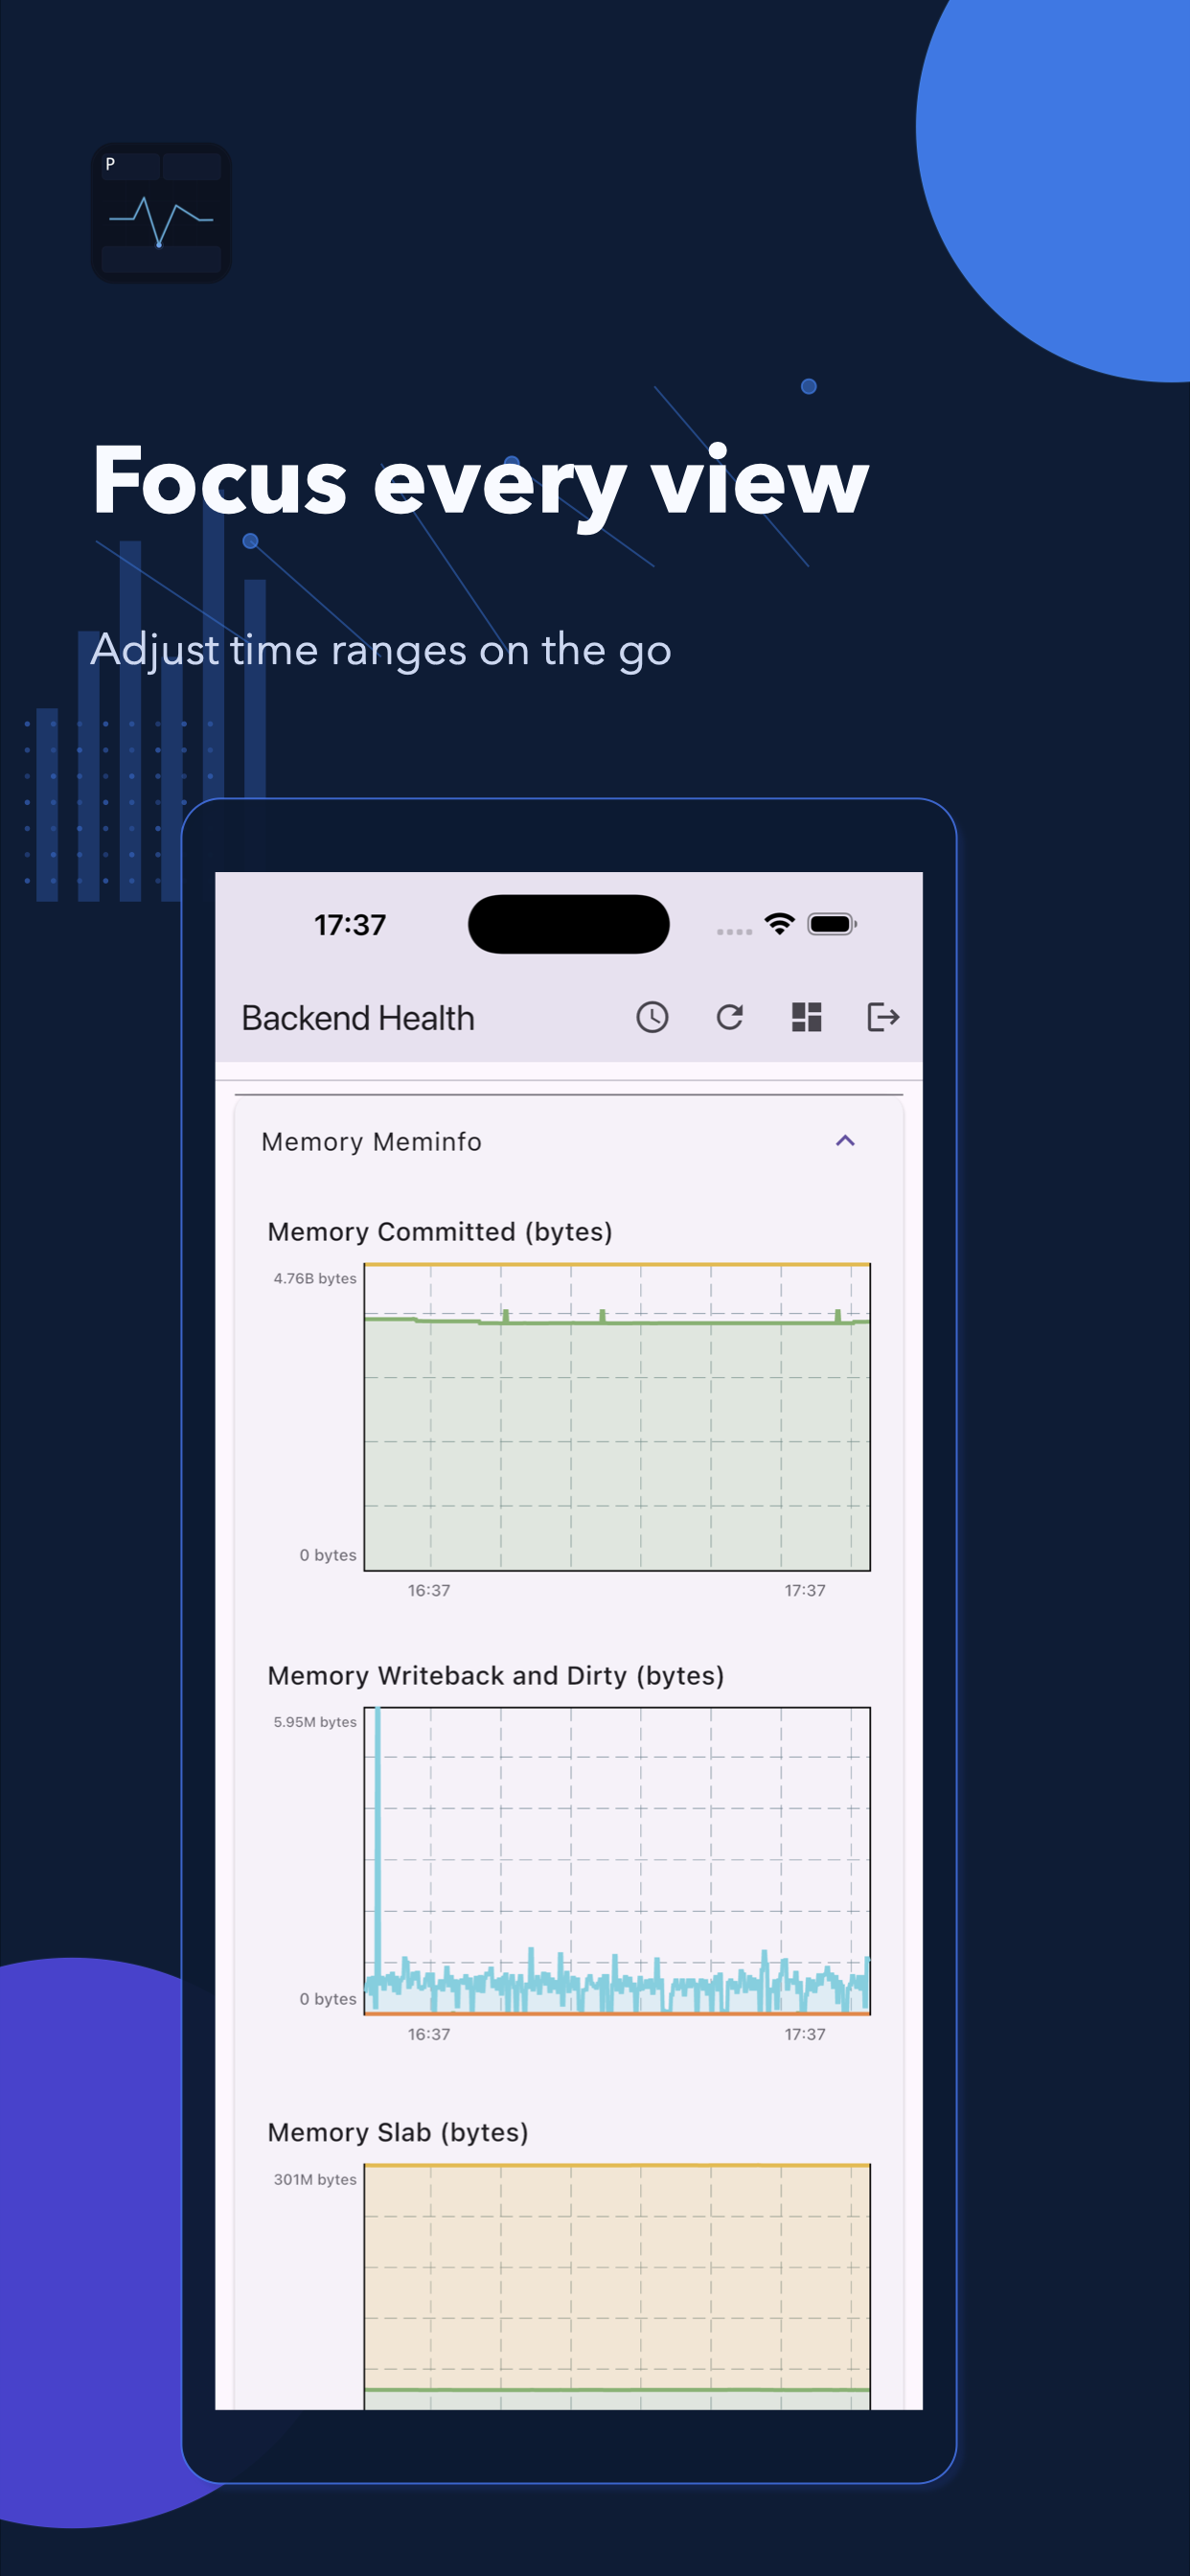
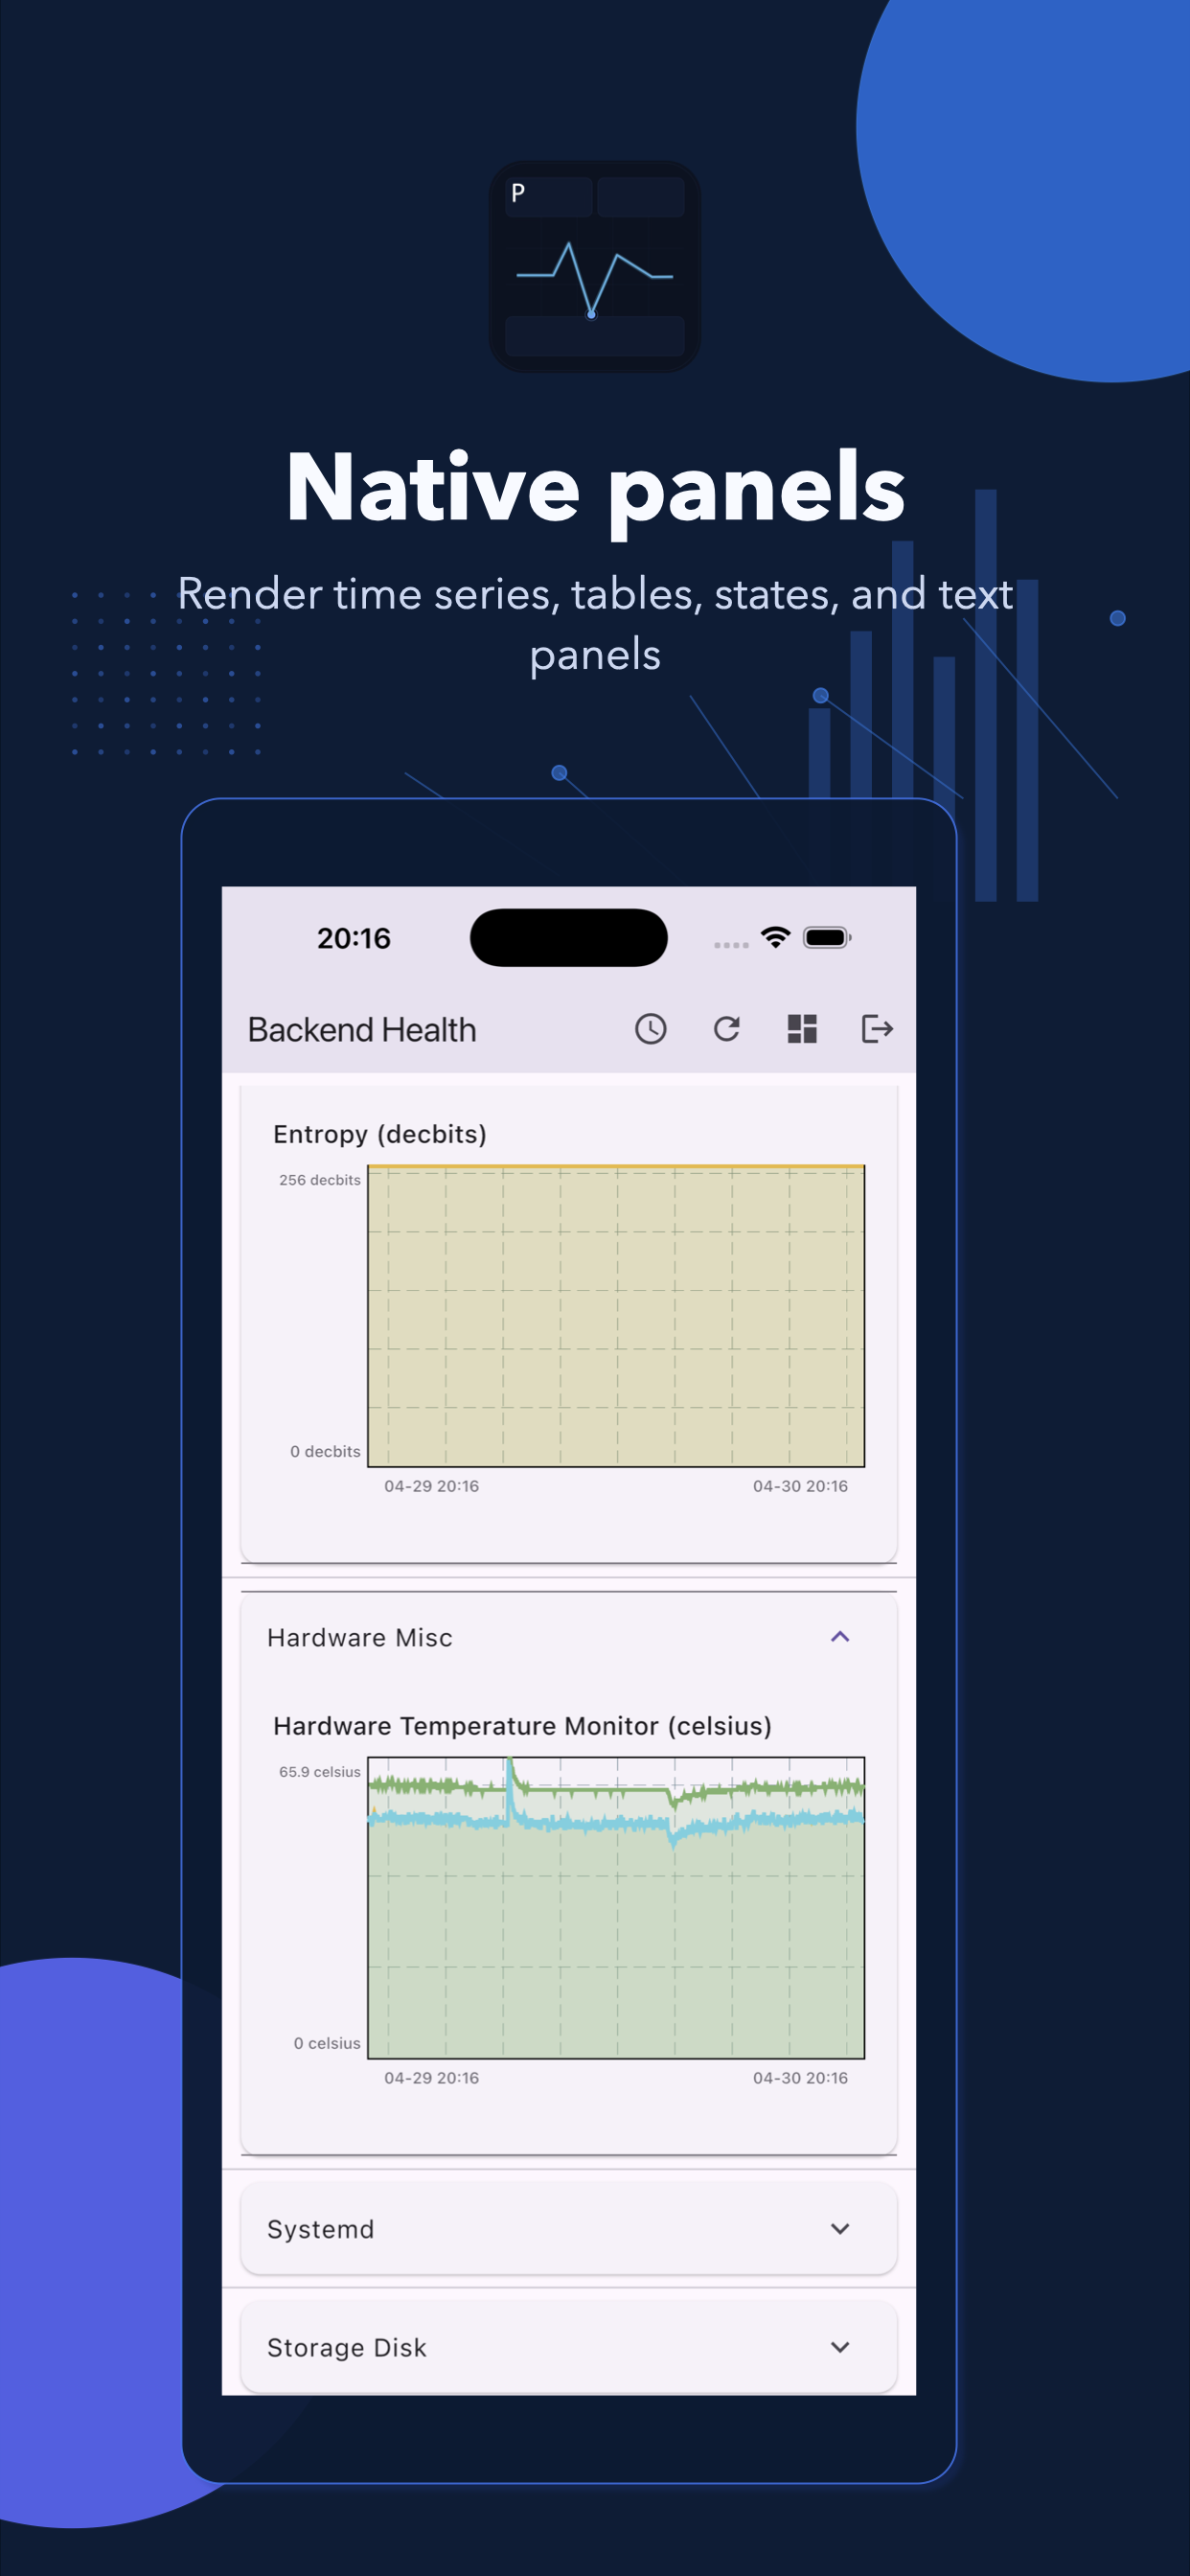
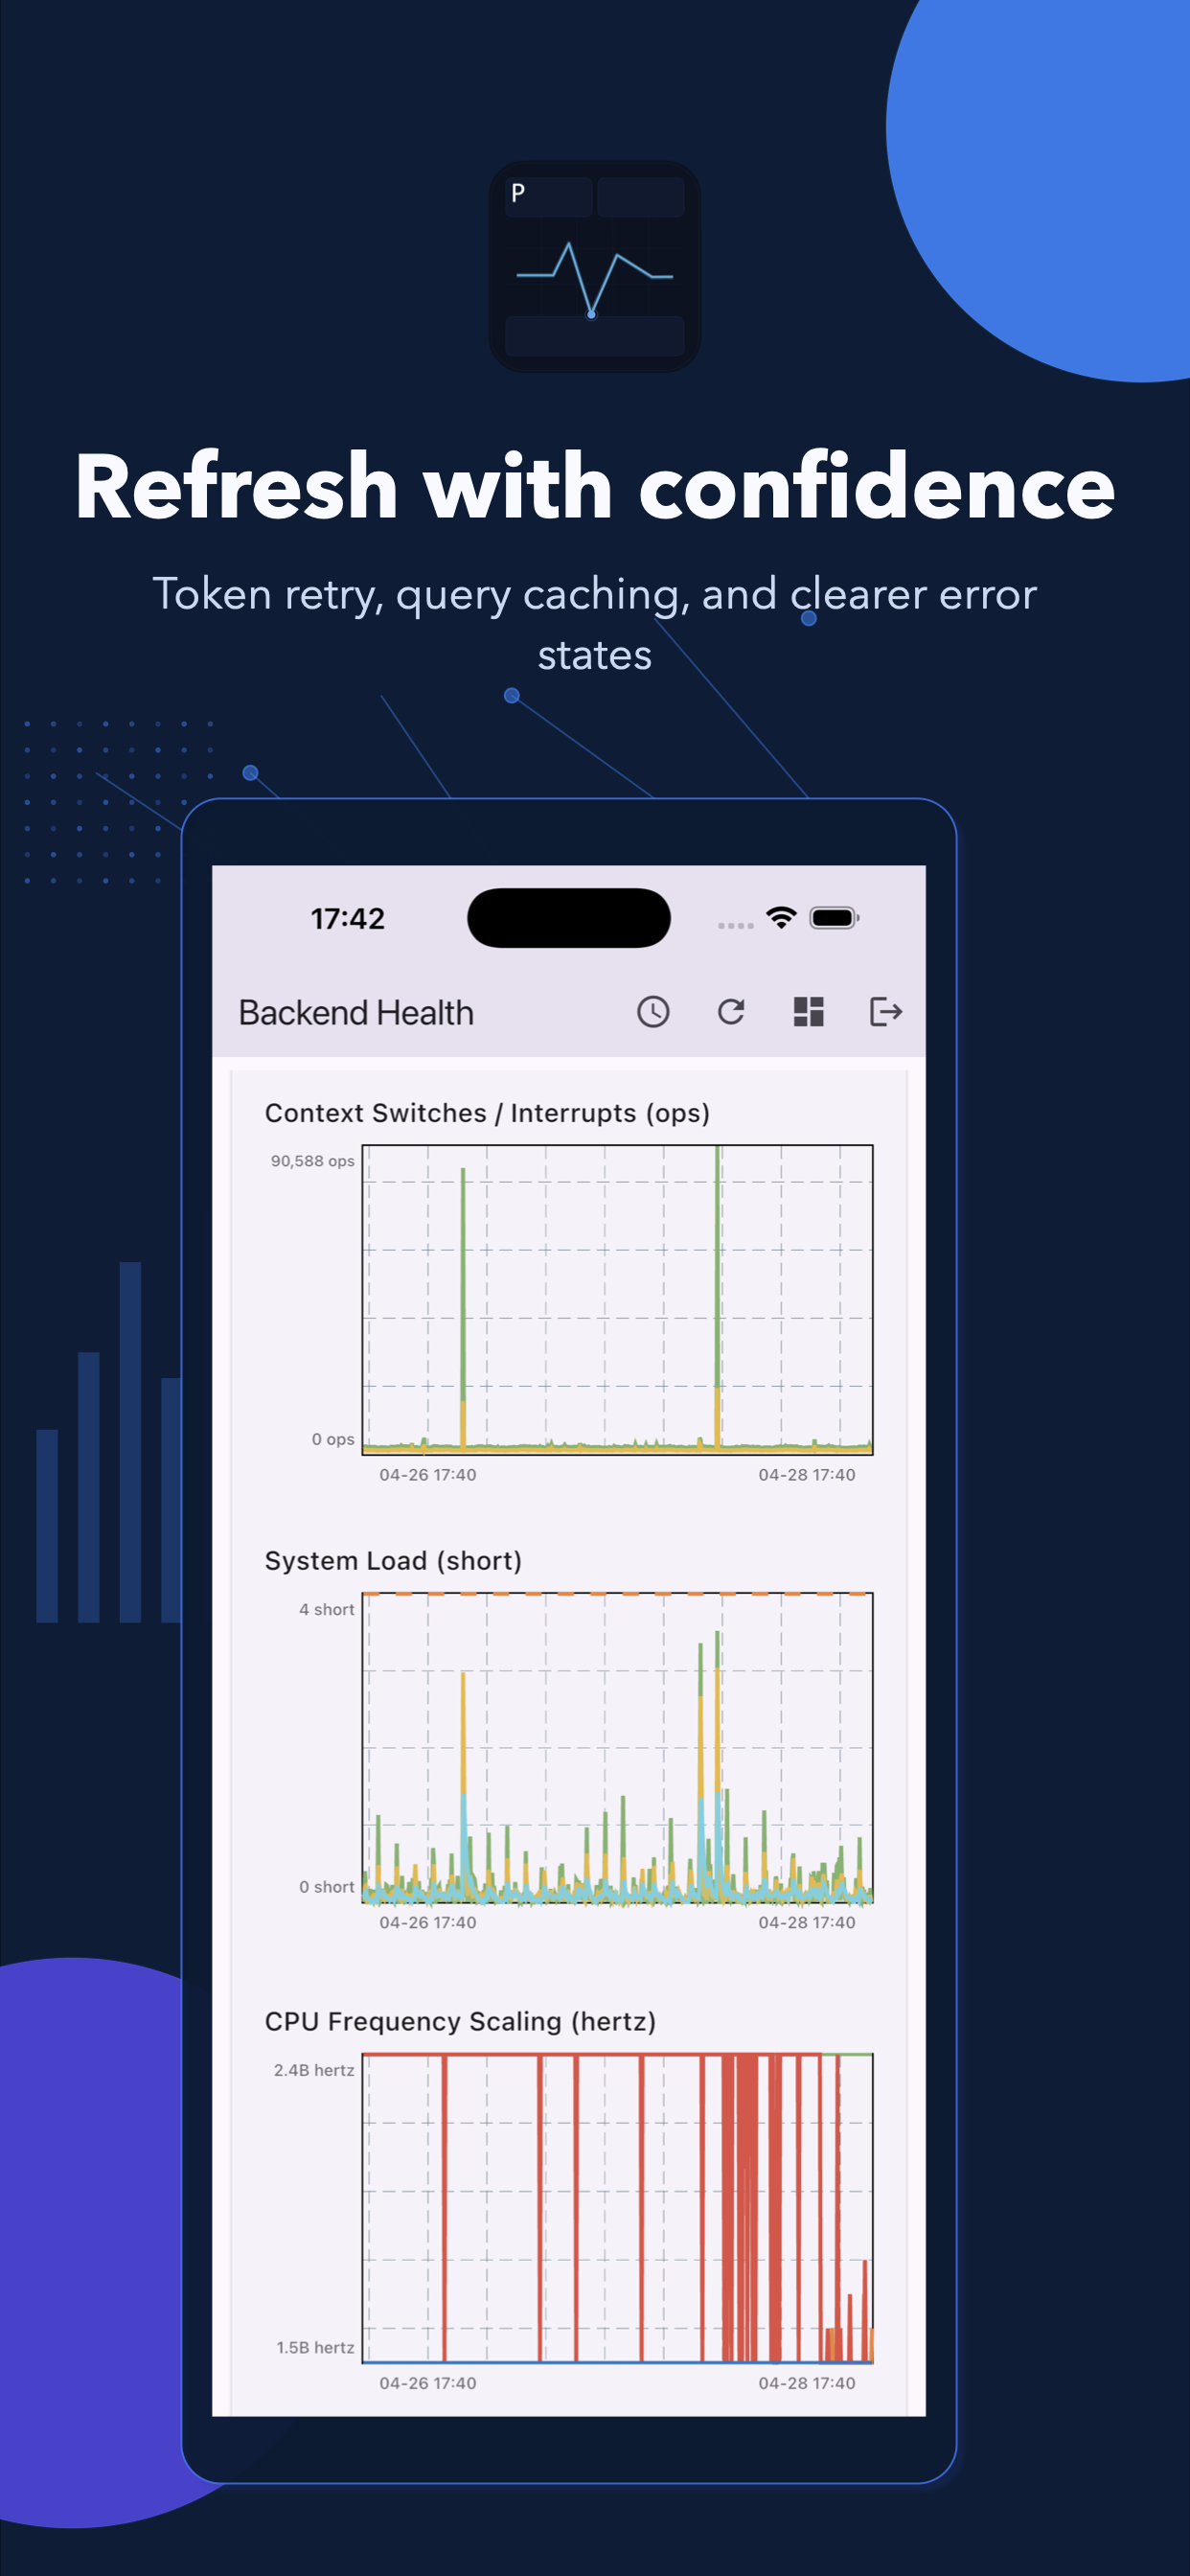
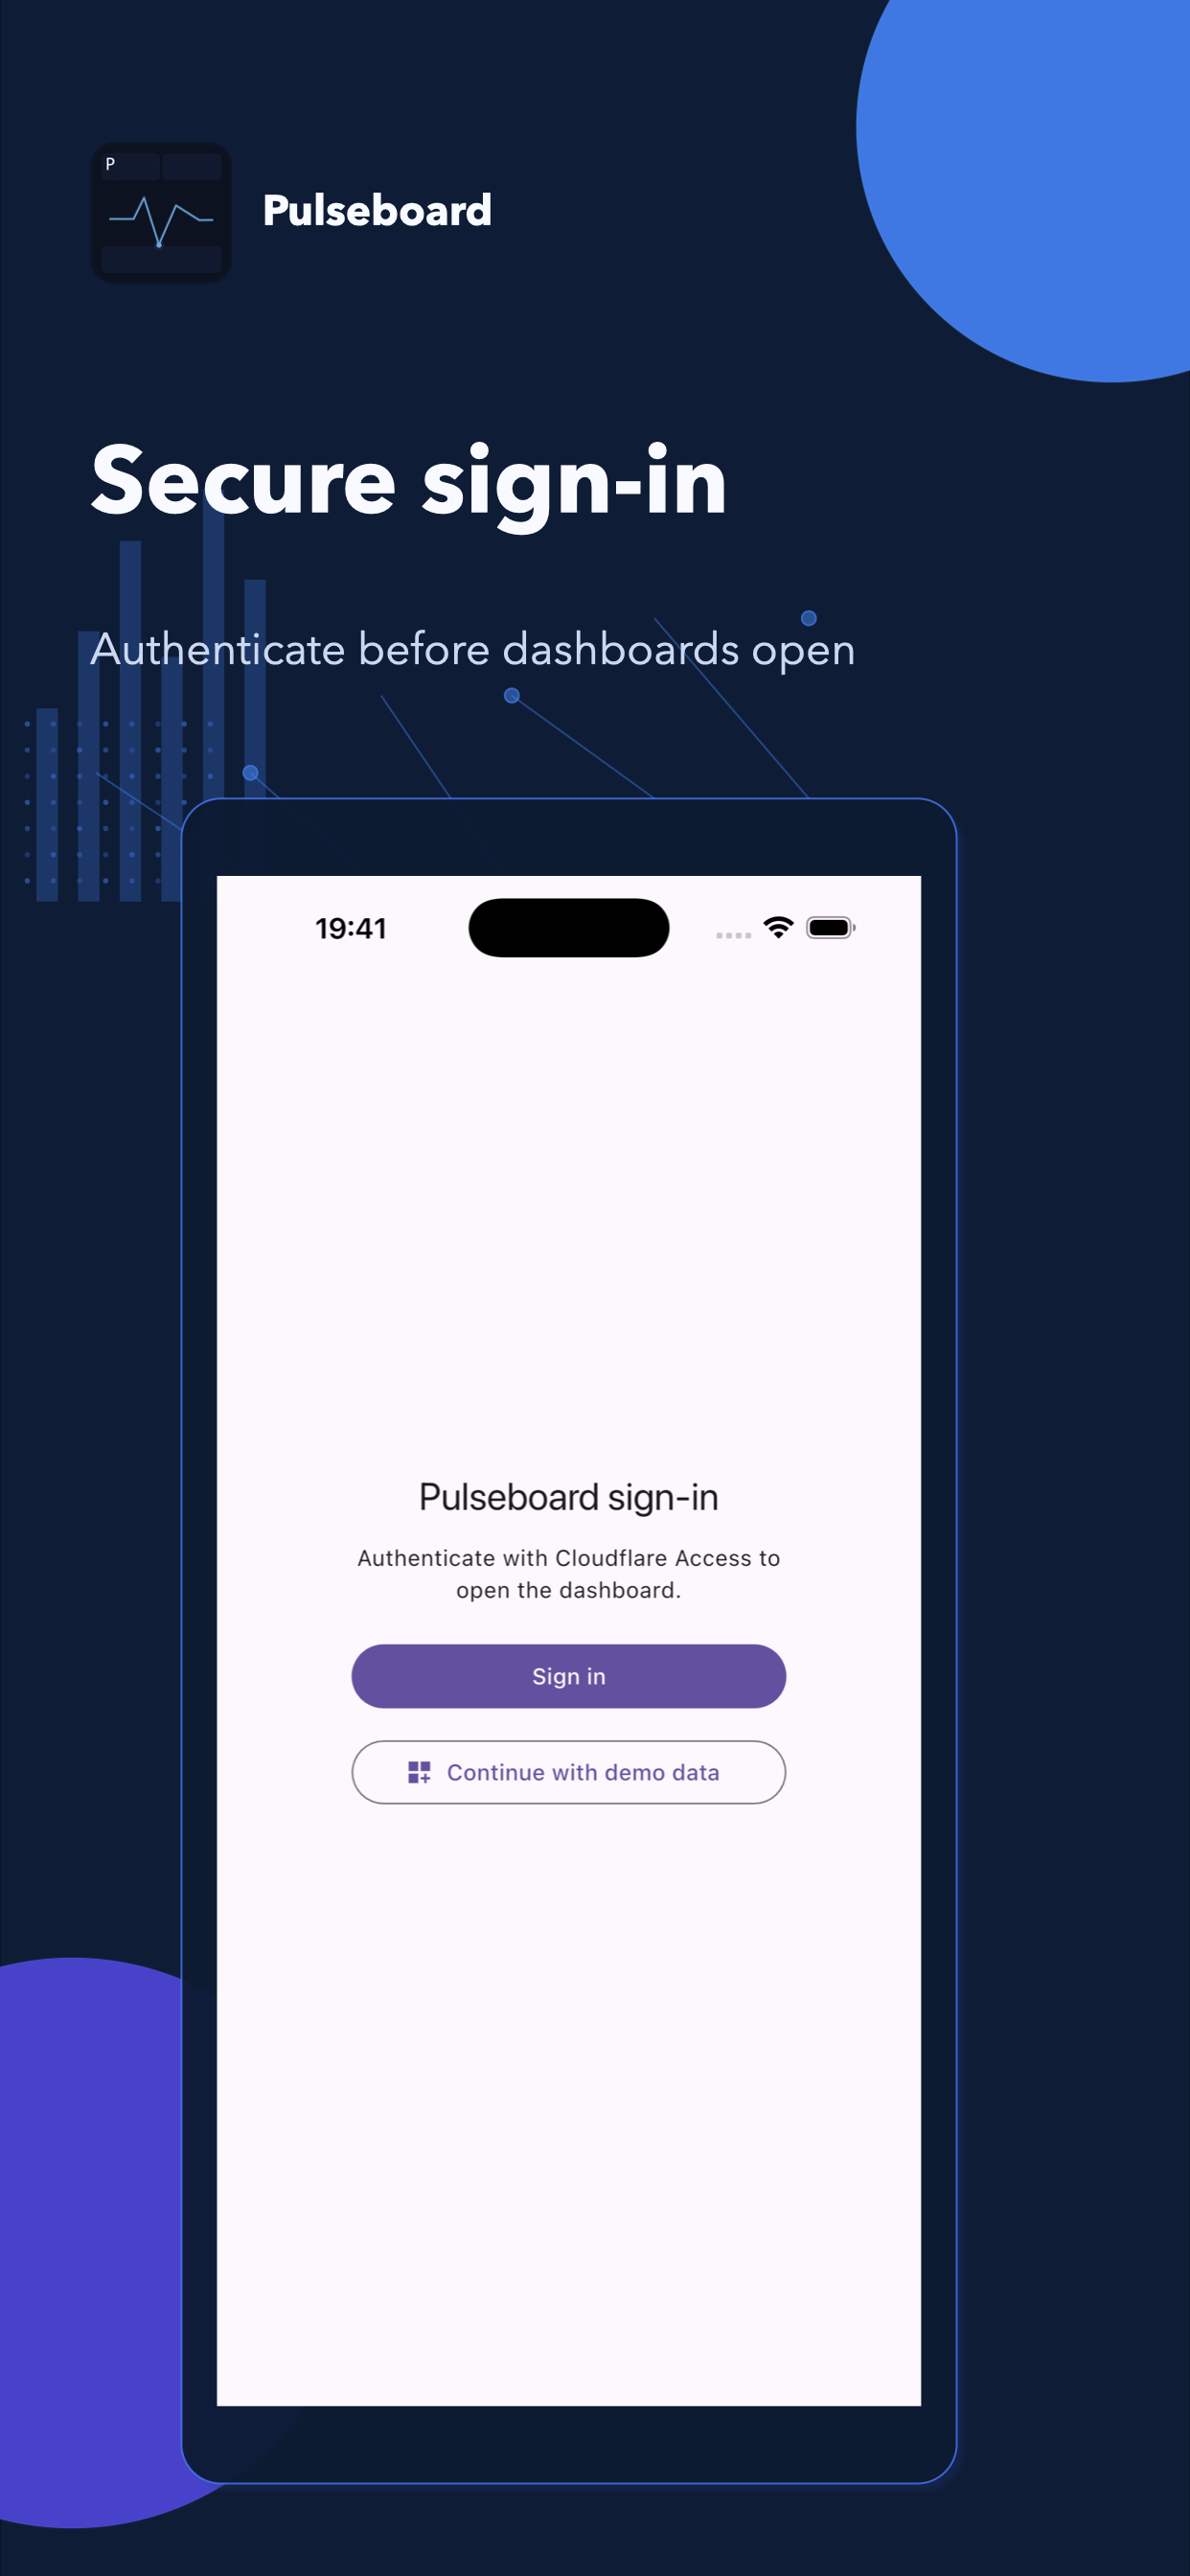
Pulseboard for iPhone and Android keeps critical telemetry checks available away from the desk. Users can sign in, browse customized dashboard views, inspect panels, adjust time ranges, and refresh the latest operational status from a native mobile interface.
Packaging
Pulseboard plans include both frontend access and backend telemetry capacity. Pricing depends on edge devices/data sources, telemetry records per month, named users, customized dashboard views, operational environments, and support requirements.
Sensors, gateways, PLCs, APIs, brokers, historians, files, or existing telemetry sources.
Curated operational views for monitoring, review, health checks, investigation, or handoff.
Separate Pulseboard Backend scopes such as production, staging, customer tenants, physical sites, or business units.
Pulseboard is available to authorized users through Client Access. For onboarding, support, account coordination, app store review access, or platform discussions, contact contact@cogniaxiom.com.
FULL DASHBOARD
Global telemetry reach
Map image could not be loaded. Please try refreshing the page.